
LinkedIn Video Analytics: How To View And Measure Results
You post a video on LinkedIn hoping it reaches your target audience. It gets views and reactions. But how many people actually watched it all the way through, and for how long? Without checking your LinkedIn video analytics, you're making decisions based on guesswork. You can't tell which videos resonate with your audience, what content keeps them watching, or why some posts perform significantly better than others.
LinkedIn provides detailed analytics for both organic video posts and paid video ads. The platform tracks metrics that show you exactly how your content performs, from view counts and watch time to engagement rates and audience demographics. You just need to know where to look and what each number actually means for your strategy.
This guide walks you through accessing your LinkedIn video analytics and interpreting the metrics that matter most. You'll learn how to view analytics for regular posts and ads, understand what each metric reveals about viewer behavior, and use those insights to create better videos that genuinely connect with your professional audience.
What LinkedIn video analytics can tell you
LinkedIn video analytics reveals how your audience interacts with your content from the moment they encounter it. You get data on who watches your videos, how long they stay engaged, and what actions they take afterward. This information helps you understand which topics resonate, what video lengths work best, and when your audience is most active.
Performance and engagement metrics
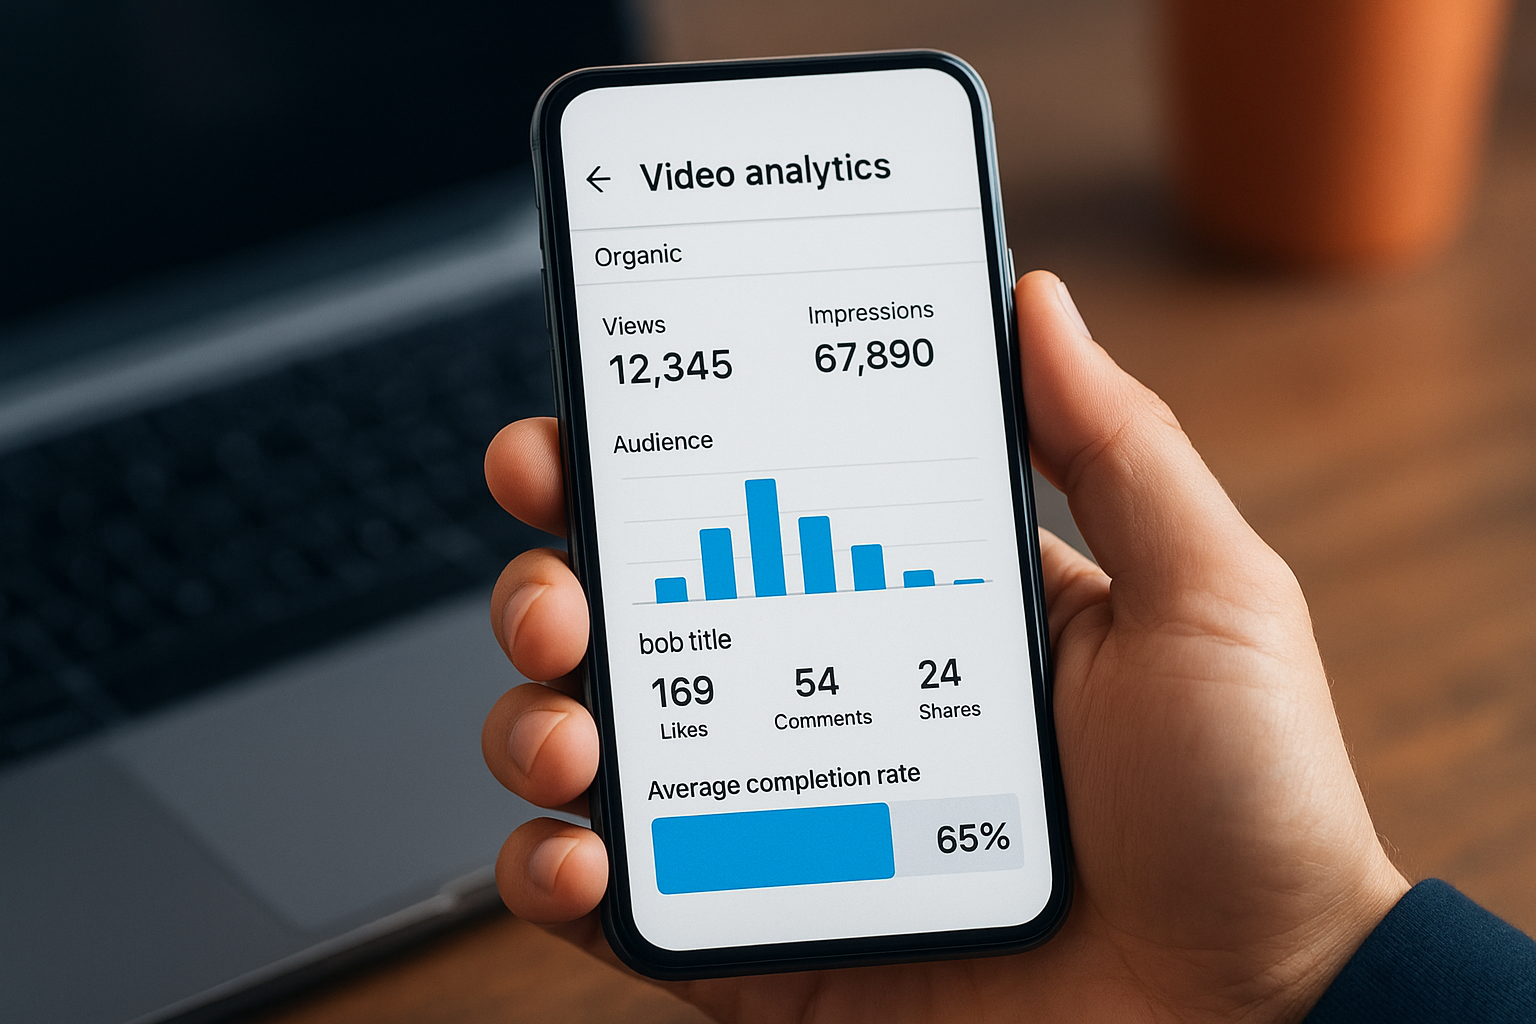
The platform tracks view counts, watch time, and completion rates to show you exactly how viewers consume your content. You can see how many people watched your video for at least three seconds (the threshold for a view), how many stayed until the end, and where most viewers drop off. LinkedIn also measures reactions, comments, shares, and clicks on any links or calls to action within your video posts.
Audience demographics and behavior
LinkedIn video analytics shows you who your viewers are based on professional attributes. You get insights into their job titles, industries, company sizes, and geographic locations. This demographic data helps you confirm whether your videos reach your intended audience or if you need to adjust your content strategy to better align with the professionals you want to engage.
Understanding your audience demographics turns generic content into targeted messages that speak directly to the people who matter most to your business goals.
Step 1. Access video analytics for your posts
LinkedIn makes it straightforward to access linkedin video analytics for your organic posts, whether you're using a desktop computer or a mobile device. You need to navigate through your profile to find the performance data for each video you've shared. The analytics dashboard shows you metrics for individual videos and helps you compare performance across different posts.
Accessing analytics on desktop
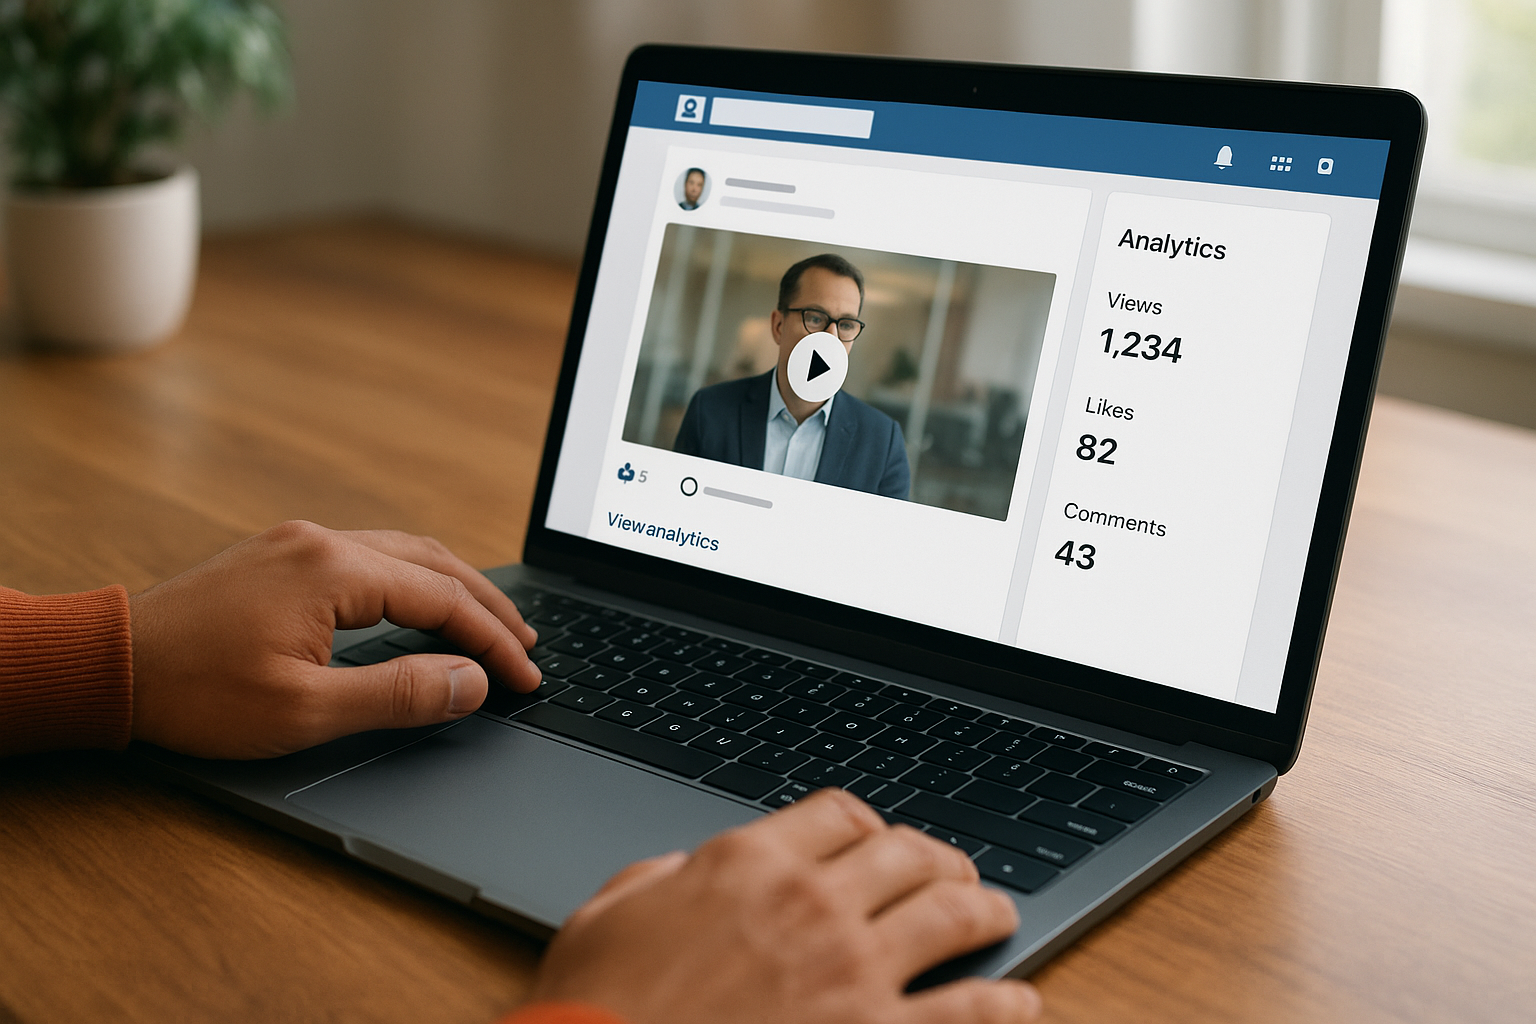
Click your profile picture in the top right corner of LinkedIn's homepage and select "View Profile" from the dropdown menu. Scroll down to the "Activity" section and click "Posts & activity" to see all your content. Locate the video post you want to analyse and click the "View analytics" or "Analytics" button that appears below the post. LinkedIn opens a detailed analytics panel showing views, engagement, and audience demographics for that specific video.
Accessing analytics on mobile
Open the LinkedIn mobile app and tap your profile picture to access your profile. Scroll to your "Activity" section and tap "See all activity" to view your posts. Find the video post you want to review and tap the three dots (ellipsis icon) in the top right corner of the post. Select "View analytics" from the menu that appears. The app displays the same core metrics you'd see on desktop, formatted for your mobile screen.
Checking your analytics regularly, ideally within the first 24 hours after posting, helps you spot early engagement patterns and adjust your promotion strategy while the content is still fresh.
Step 2. View analytics for video ads
LinkedIn separates paid video ad analytics from organic post metrics, housing them in Campaign Manager where you manage all advertising campaigns. The analytics for video ads provide more granular data than organic posts, including specific performance metrics tied to your campaign objectives and detailed audience insights that help you optimise your ad spend.
Navigating to Campaign Manager
Access Campaign Manager by clicking the "Advertise" icon in the top right corner of LinkedIn's navigation bar, then select "Campaign Manager" from the dropdown menu. You can also navigate directly to the Campaign Manager URL if you've bookmarked it. Once inside, you see a dashboard listing all your active and past campaigns. Click on the specific campaign containing your video ads to view its performance data.
Selecting video metrics
Campaign Manager displays standard metrics by default, but you need to customise your view to see video-specific analytics. Click the "Columns" button above your campaign data table and select "Video" from the available column sets. This action reveals metrics like video views, view rates, completion rates, and average watch time. You can also export these metrics by clicking "Export" and choosing your preferred file format for deeper analysis in spreadsheet applications.
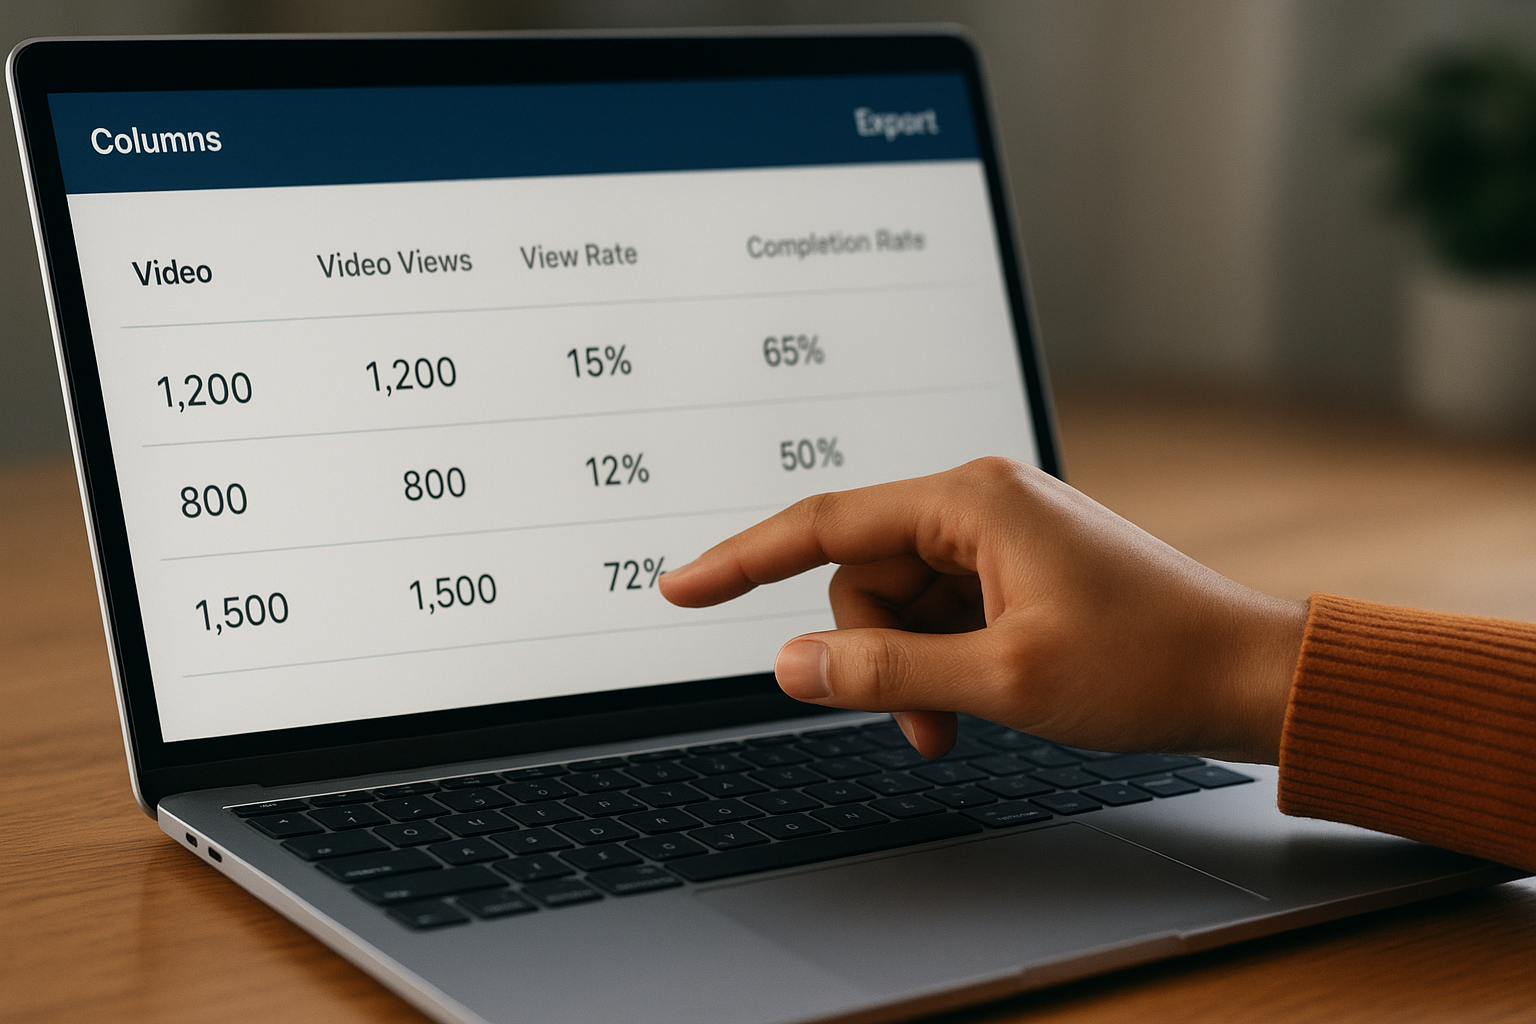
Video ad analytics update in near real-time, allowing you to spot underperforming content and adjust your campaigns before you exhaust your budget on ineffective creative.
Step 3. Understand the key metrics
LinkedIn video analytics provides multiple data points that each reveal different aspects of your video's performance. You need to know what each metric actually measures and how it connects to your content goals. Some numbers indicate reach and visibility, while others show genuine engagement and interest from your audience. Understanding these distinctions helps you prioritise the metrics that align with your specific objectives.
View-related metrics
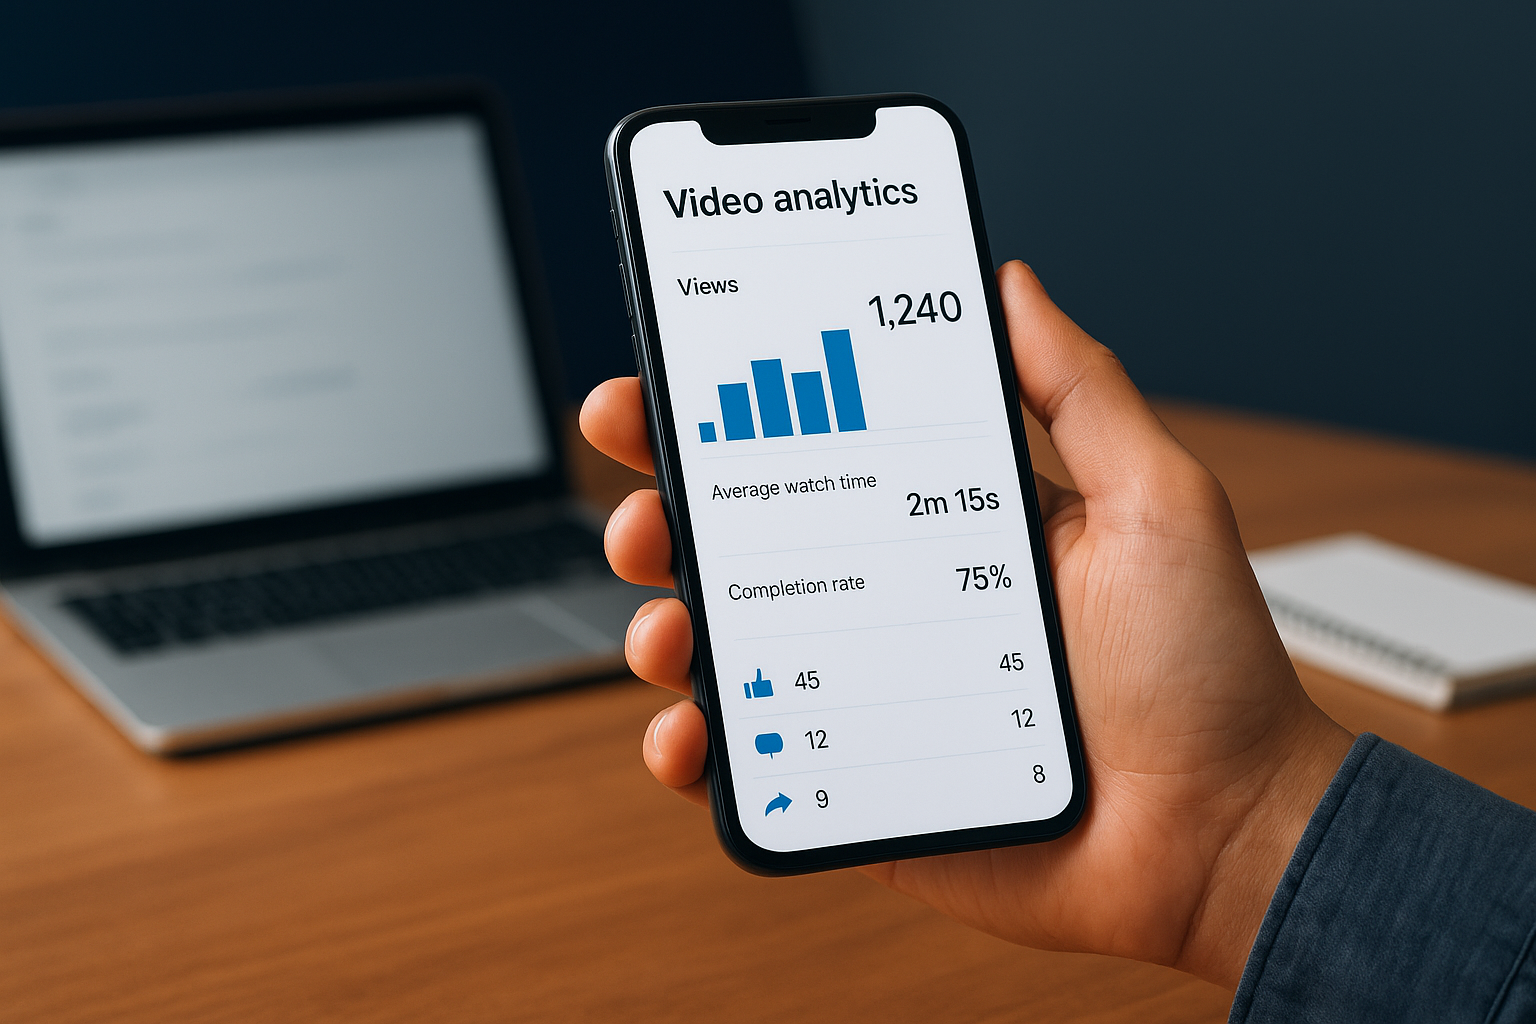
LinkedIn counts a view when someone watches your video for at least three seconds, which sets the baseline for measuring reach. The view count tells you how many times people initiated playback, while impressions show how many times your video appeared in someone's feed, regardless of whether they played it. The completion rate reveals the percentage of viewers who watched your entire video, giving you insight into how well your content holds attention from start to finish.
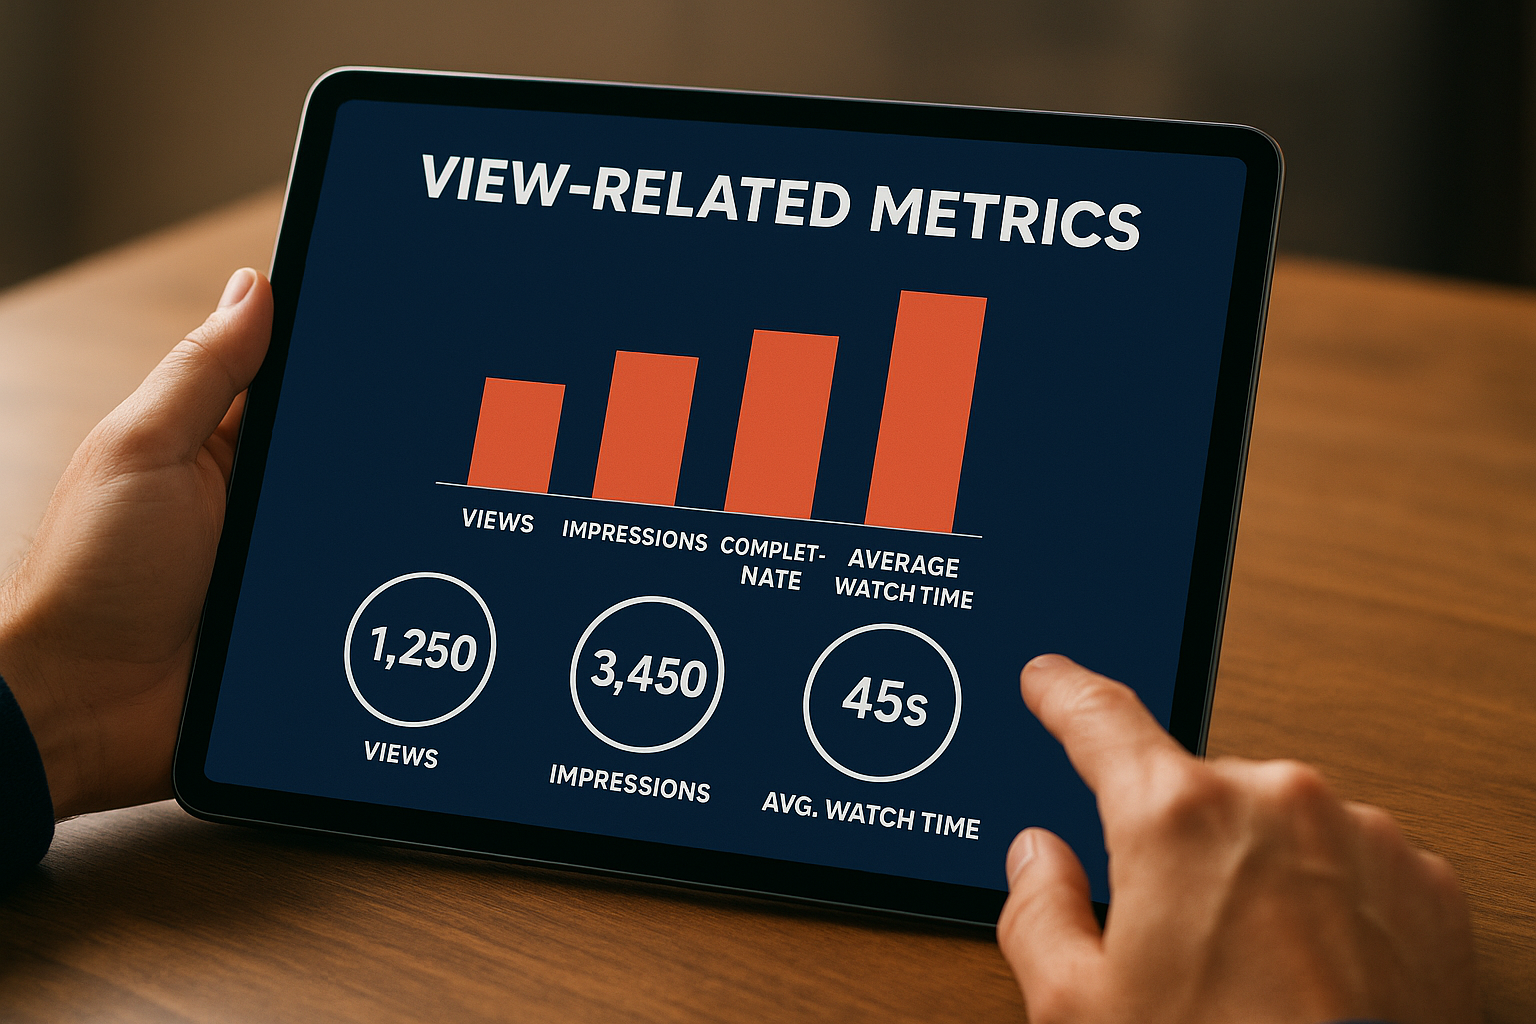
Average watch time measures how long viewers typically stay engaged with your video. If your video runs three minutes but the average watch time sits at 45 seconds, you know most viewers lose interest before reaching your main message. LinkedIn also tracks view percentage at different intervals (25%, 50%, 75%, 100%), helping you identify exactly where viewers drop off.
Engagement metrics
Reactions, comments, and shares indicate how viewers respond to your content beyond passive watching. A high view count with low engagement suggests your video gets distribution but fails to spark meaningful interaction. Click-through rate (CTR) measures how many viewers click on links, calls to action, or your profile after watching, connecting video performance to concrete business outcomes.
Share rate deserves special attention because each share expands your reach to new networks of professionals. When viewers share your video, they essentially endorse your content to their connections, making shares more valuable than reactions for building authority and expanding your audience.
Audience demographics
LinkedIn breaks down viewer demographics by job title, industry, company size, and location, showing you who actually watches your videos. You might discover your content resonates with marketing directors at mid-size companies instead of the C-level executives you originally targeted. This data helps you refine your messaging and content strategy to better serve the audience that responds to your videos.
Tracking audience demographics over multiple videos reveals patterns that help you create content specifically for the professionals most likely to engage with your brand.
Step 4. Turn analytics into better videos
Your linkedin video analytics only becomes valuable when you act on the patterns you discover. The data reveals what works and what doesn't, but you need to translate those insights into concrete changes for your next videos. Most professionals review analytics without modifying their approach, missing opportunities to consistently improve their content performance.
Optimise video length based on watch time
Your average watch time reveals the ideal length for your audience. If viewers consistently watch 60 seconds of your 120-second videos, create shorter videos around the 60-second mark to boost completion rates. LinkedIn's algorithm favours videos with high completion rates, potentially giving your content more reach when viewers watch all the way through.
Test different lengths systematically. Post a 45-second video one week, then a 90-second video the next, comparing completion rates and engagement for similar topics. Track which duration generates the most shares and comments, as these metrics indicate genuine interest beyond passive viewing.
Adjust content based on drop-off points
LinkedIn shows you exactly where viewers stop watching, pinpointing weak sections in your videos. If 70% of viewers drop off at the 30-second mark, something happens at that timestamp that loses their attention. Review your video to identify whether a slow segment, confusing transition, or loss of energy causes the exodus.
Restructure your videos by moving your most compelling content earlier. Place your key message or most interesting visual within the first 15 seconds instead of building up to it gradually. Cut any introductory fluff that delays your main point, as professional audiences on LinkedIn prefer direct, efficient communication.
Replicate successful formats
Identify your top-performing videos by completion rate and engagement, then analyse what they have in common. You might discover that videos featuring direct camera addresses outperform screen recordings, or that specific topics consistently generate more shares. Document these patterns in a simple spreadsheet tracking format, topic, length, and key metrics.
Successful content creation on LinkedIn relies on pattern recognition rather than guesswork, with your analytics providing the evidence base for strategic decisions.
Create a video template based on your best performers. If talking-head videos with text overlays and three-second cuts between points drive your highest engagement, structure your next five videos using that exact format before testing variations.
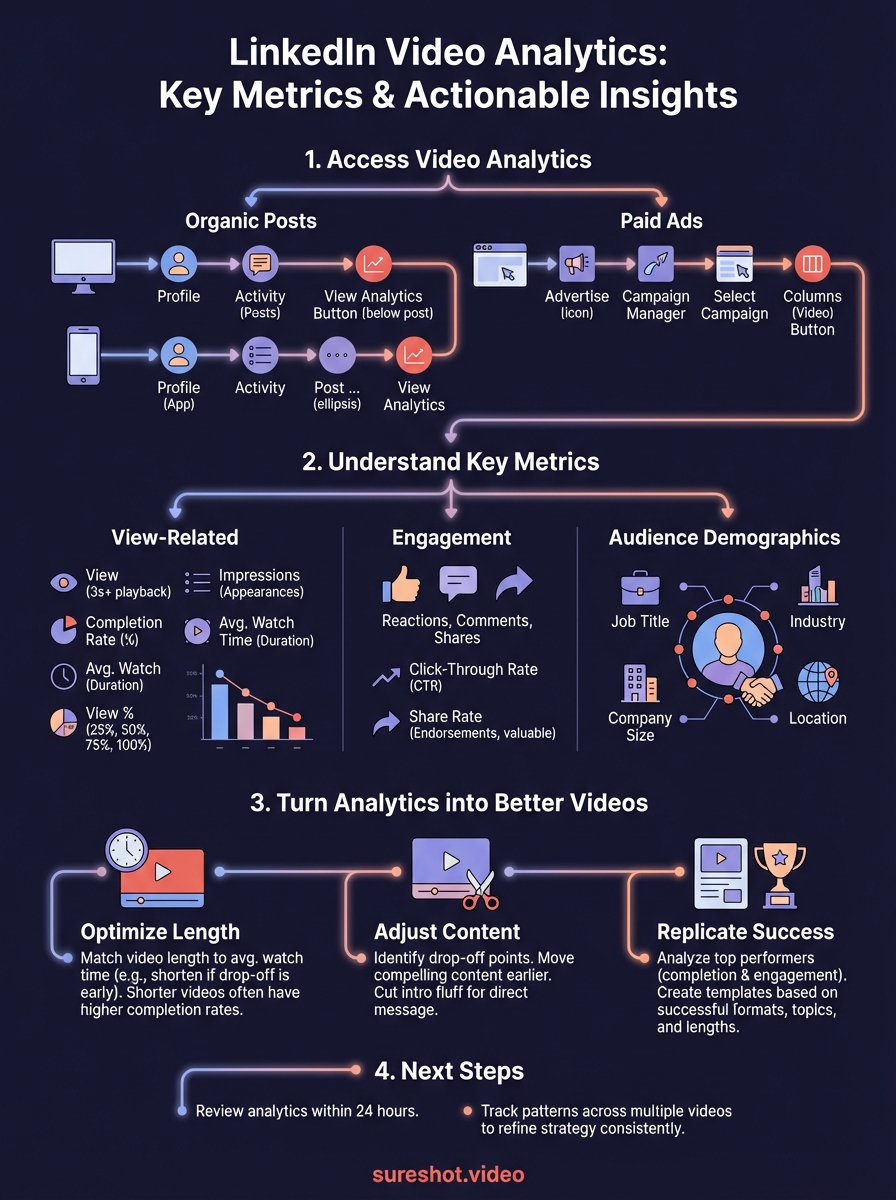
Next steps
You now know how to access linkedin video analytics, interpret the metrics that matter, and adjust your content strategy based on real performance data. The next step involves applying these insights consistently to every video you create. Review your analytics within 24 hours of posting, track patterns across multiple videos, and refine your approach based on what the data reveals about your audience.
Video content only grows more important on LinkedIn as professionals increasingly prefer watching over reading. If you're organising events and want to capture authentic moments from attendees, SureShot helps you collect, curate, and deploy user-generated videos at scale for greater reach and engagement. Book a 30-minute demo to see how event organizers use attendee-created content to build stronger communities and reduce production costs.